AREG’s High-Altitude Ballooning sub-group, Project Horus, is planning their next launch for Sunday the 1st of December, with a planned launch time of 10 AM ACDST. If we have to scrub due to poor weather, the backup launch date will be the 8th of December.
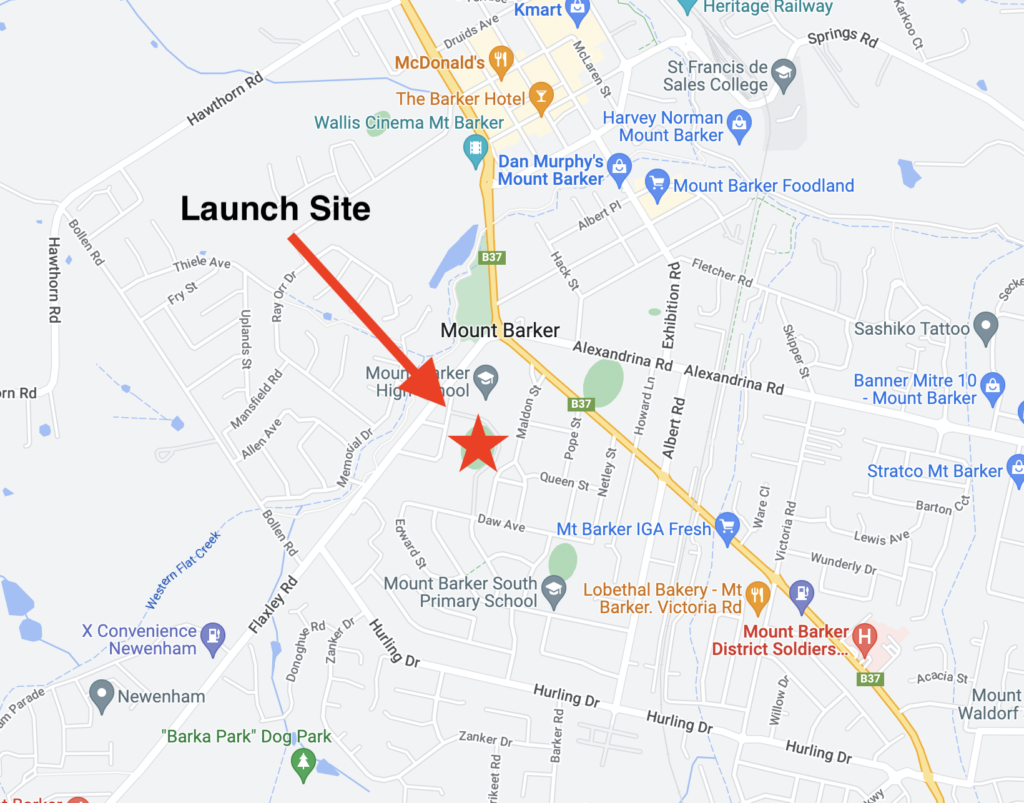
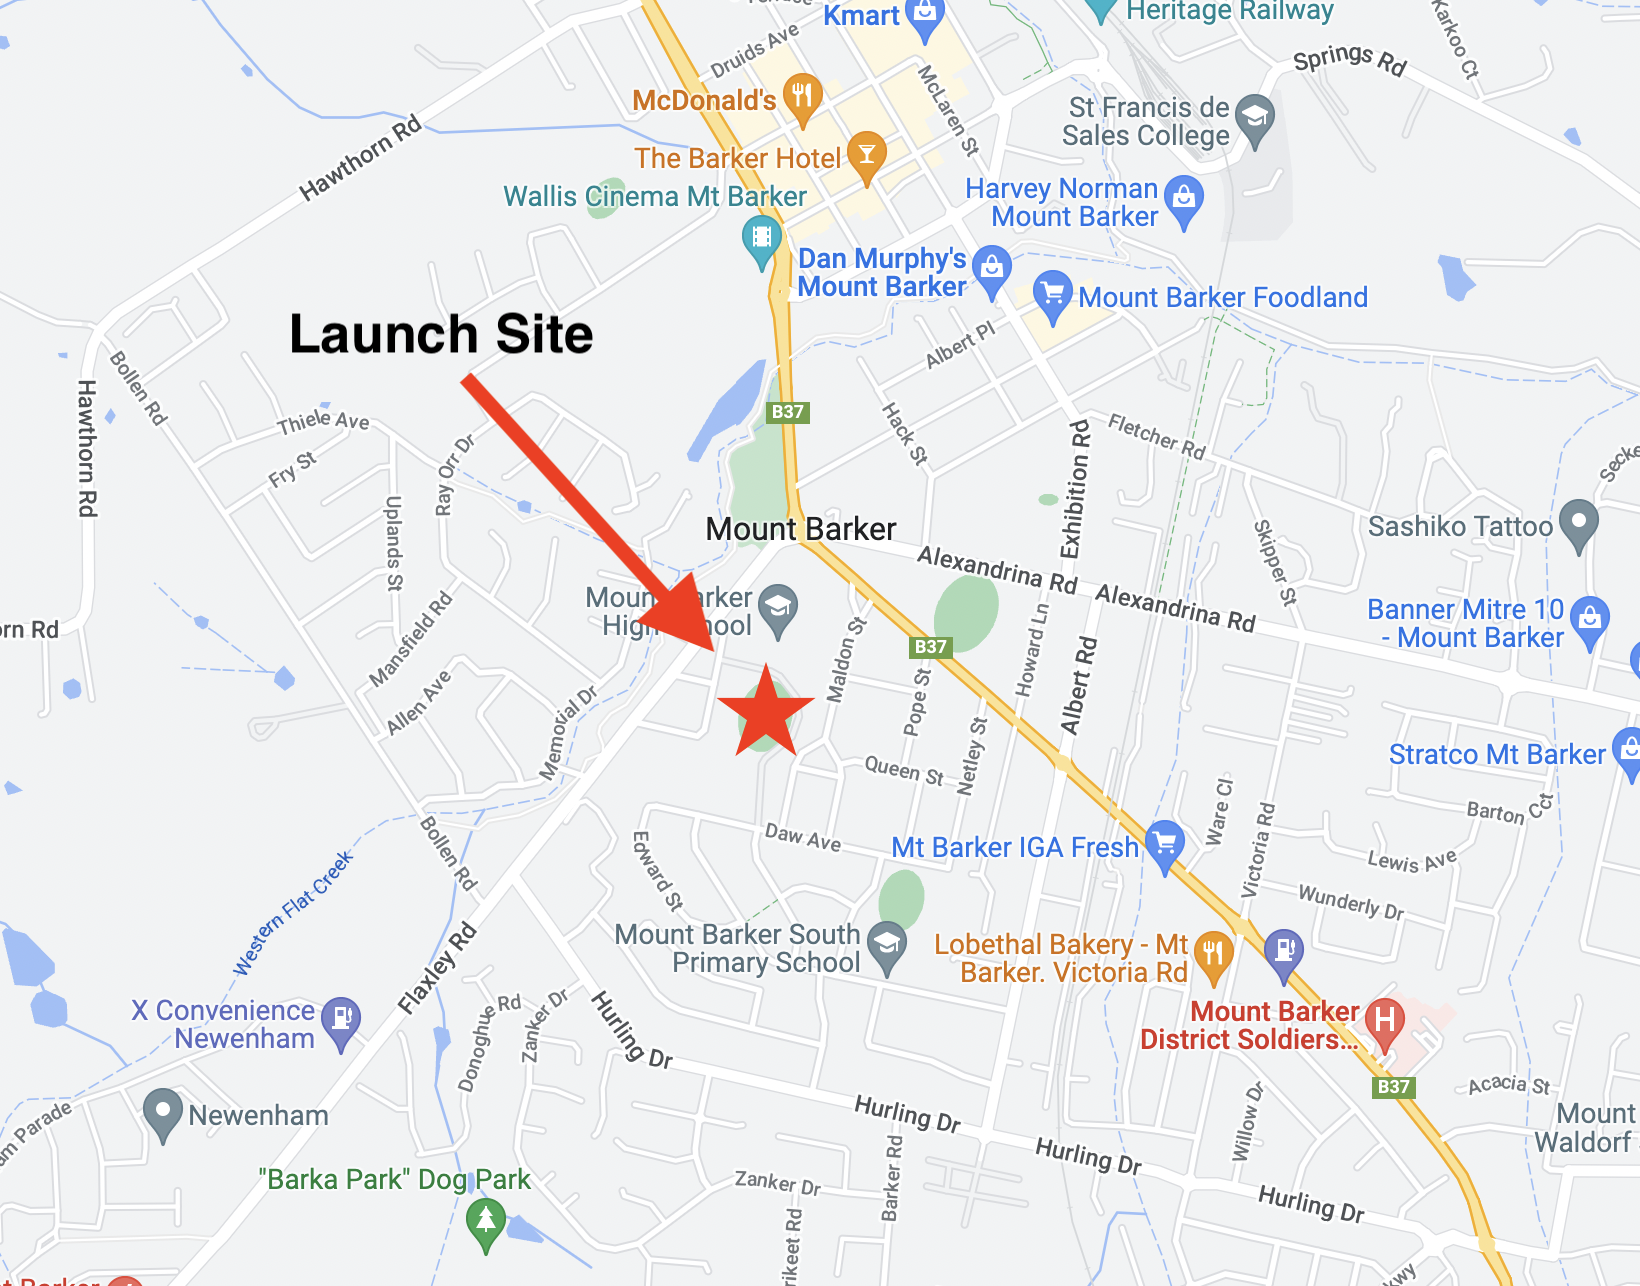
UPDATE 27th Nov: This launch is currently planned to be performed from the Mt Barker High School Oval with the launch team arriving on site from around 9:15 AM. Note that access to the oval is via Stephenson street, and parking near the oval is extremely limited.
TRACKING LINKS
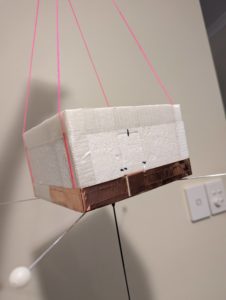
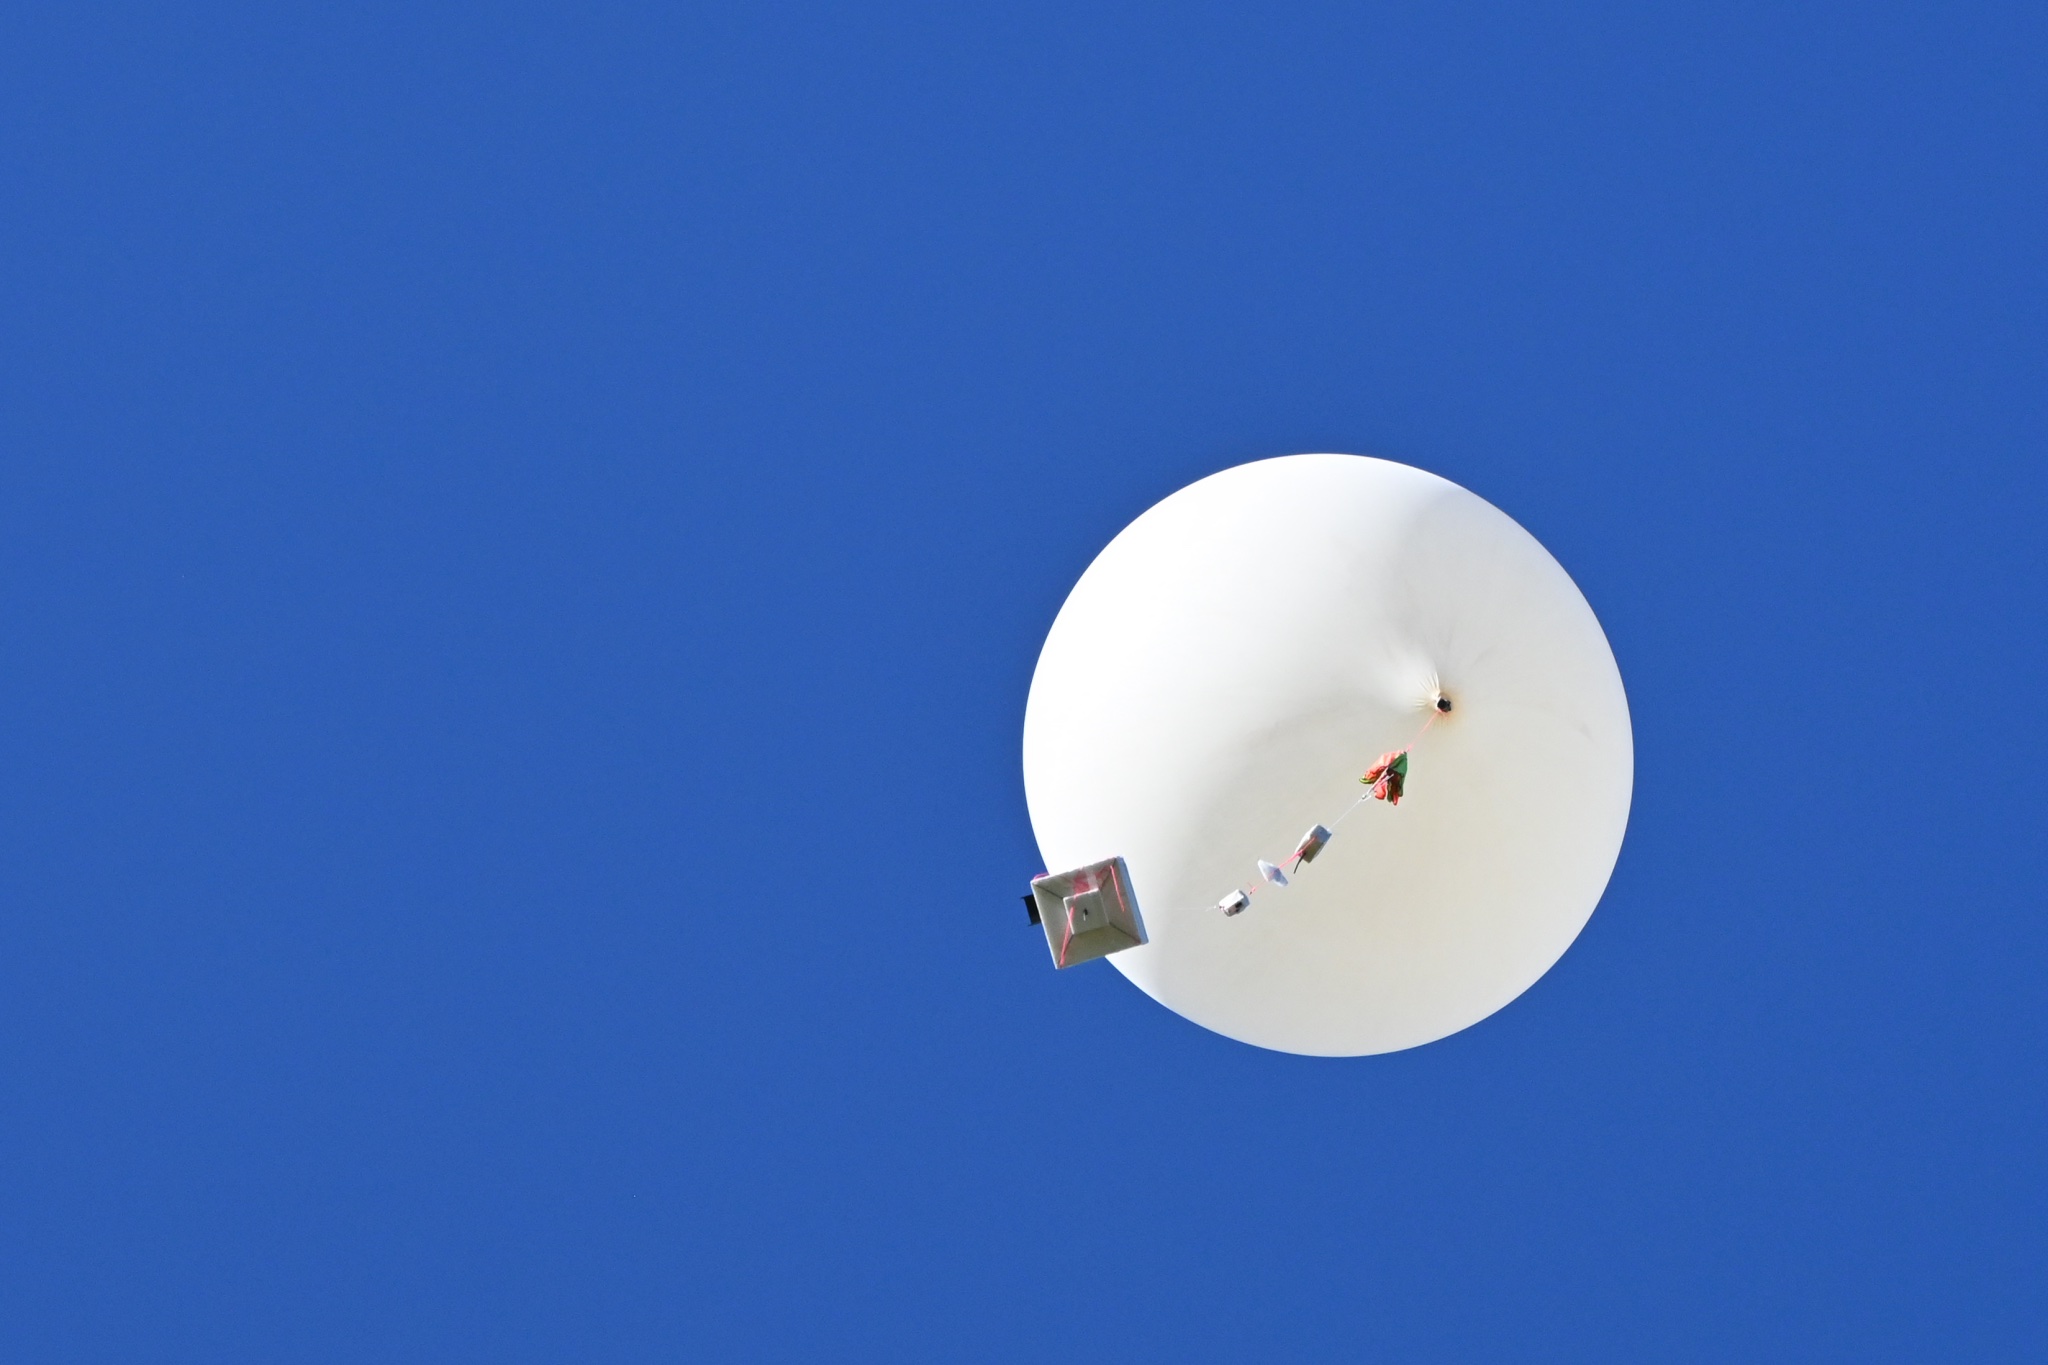
This flight will feature a new cross-band repeater payload, enabling amateur radio operators around the state to communicate via the balloon! Along with this will be a newly built Wenet Imagery payload, using a PiCam v3 in autofocus mode.
- FM Crossband Repeater: 145.075 MHz Input (91.5 Hz CTCSS), 438.975 MHz output.
- Wenet Imagery on 443.5 MHz.
- Primary Horus Binary telemetry on 434.200 MHz
- Backup Horus Binary payload, on 434.210 MHz
- TheThingsNetwork tracking payload, using the AU915 band-plan.
During the flight, all the payloads can be tracked lived on the SondeHub-Amateur tracker here!
FM Cross-band Repeater Payload
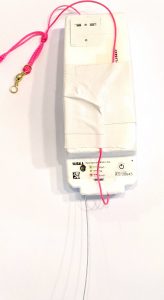
This is the first test flight of a new experimental FM cross band voice repeater based around a Yaesu FT-530 handheld transceiver.The balloon repeater should be heard on:
- INPUT: 145.075MHz with 91.5Hz CTCSS
- OUTPUT: 438.975MHz – 0.5W into 1/2-wave omni
Please note that this repeater is experimental, and may have performance issues or even fail completely during the flight!
To transmit to the balloon at the maximum range of 800km (once the balloon reaches 100,000ft ++) you should only need approximately 10-20W and an 2-4dB gain antenna.
Receiving the balloon at 400km range in a handheld environment should be achievable, but to hear the repeater at the maximum range of 800km you should expect to need a 10dB gain Yagi for a 0.4uV capable receiver and 2dB feeder loss
This setup is much the same as the LEO satellites but without the doppler shift.
PLEASE MAKE SURE YOU CAN HEAR IT BEFORE YOU TRANSMIT!
This repeater will be operated as a controlled net, with the net control callsign VK5ARG – please listen out for net control before calling!
We will be offering QSL cards to stations that make a contact with net control during the flight, so get your stations setup and give it a go!
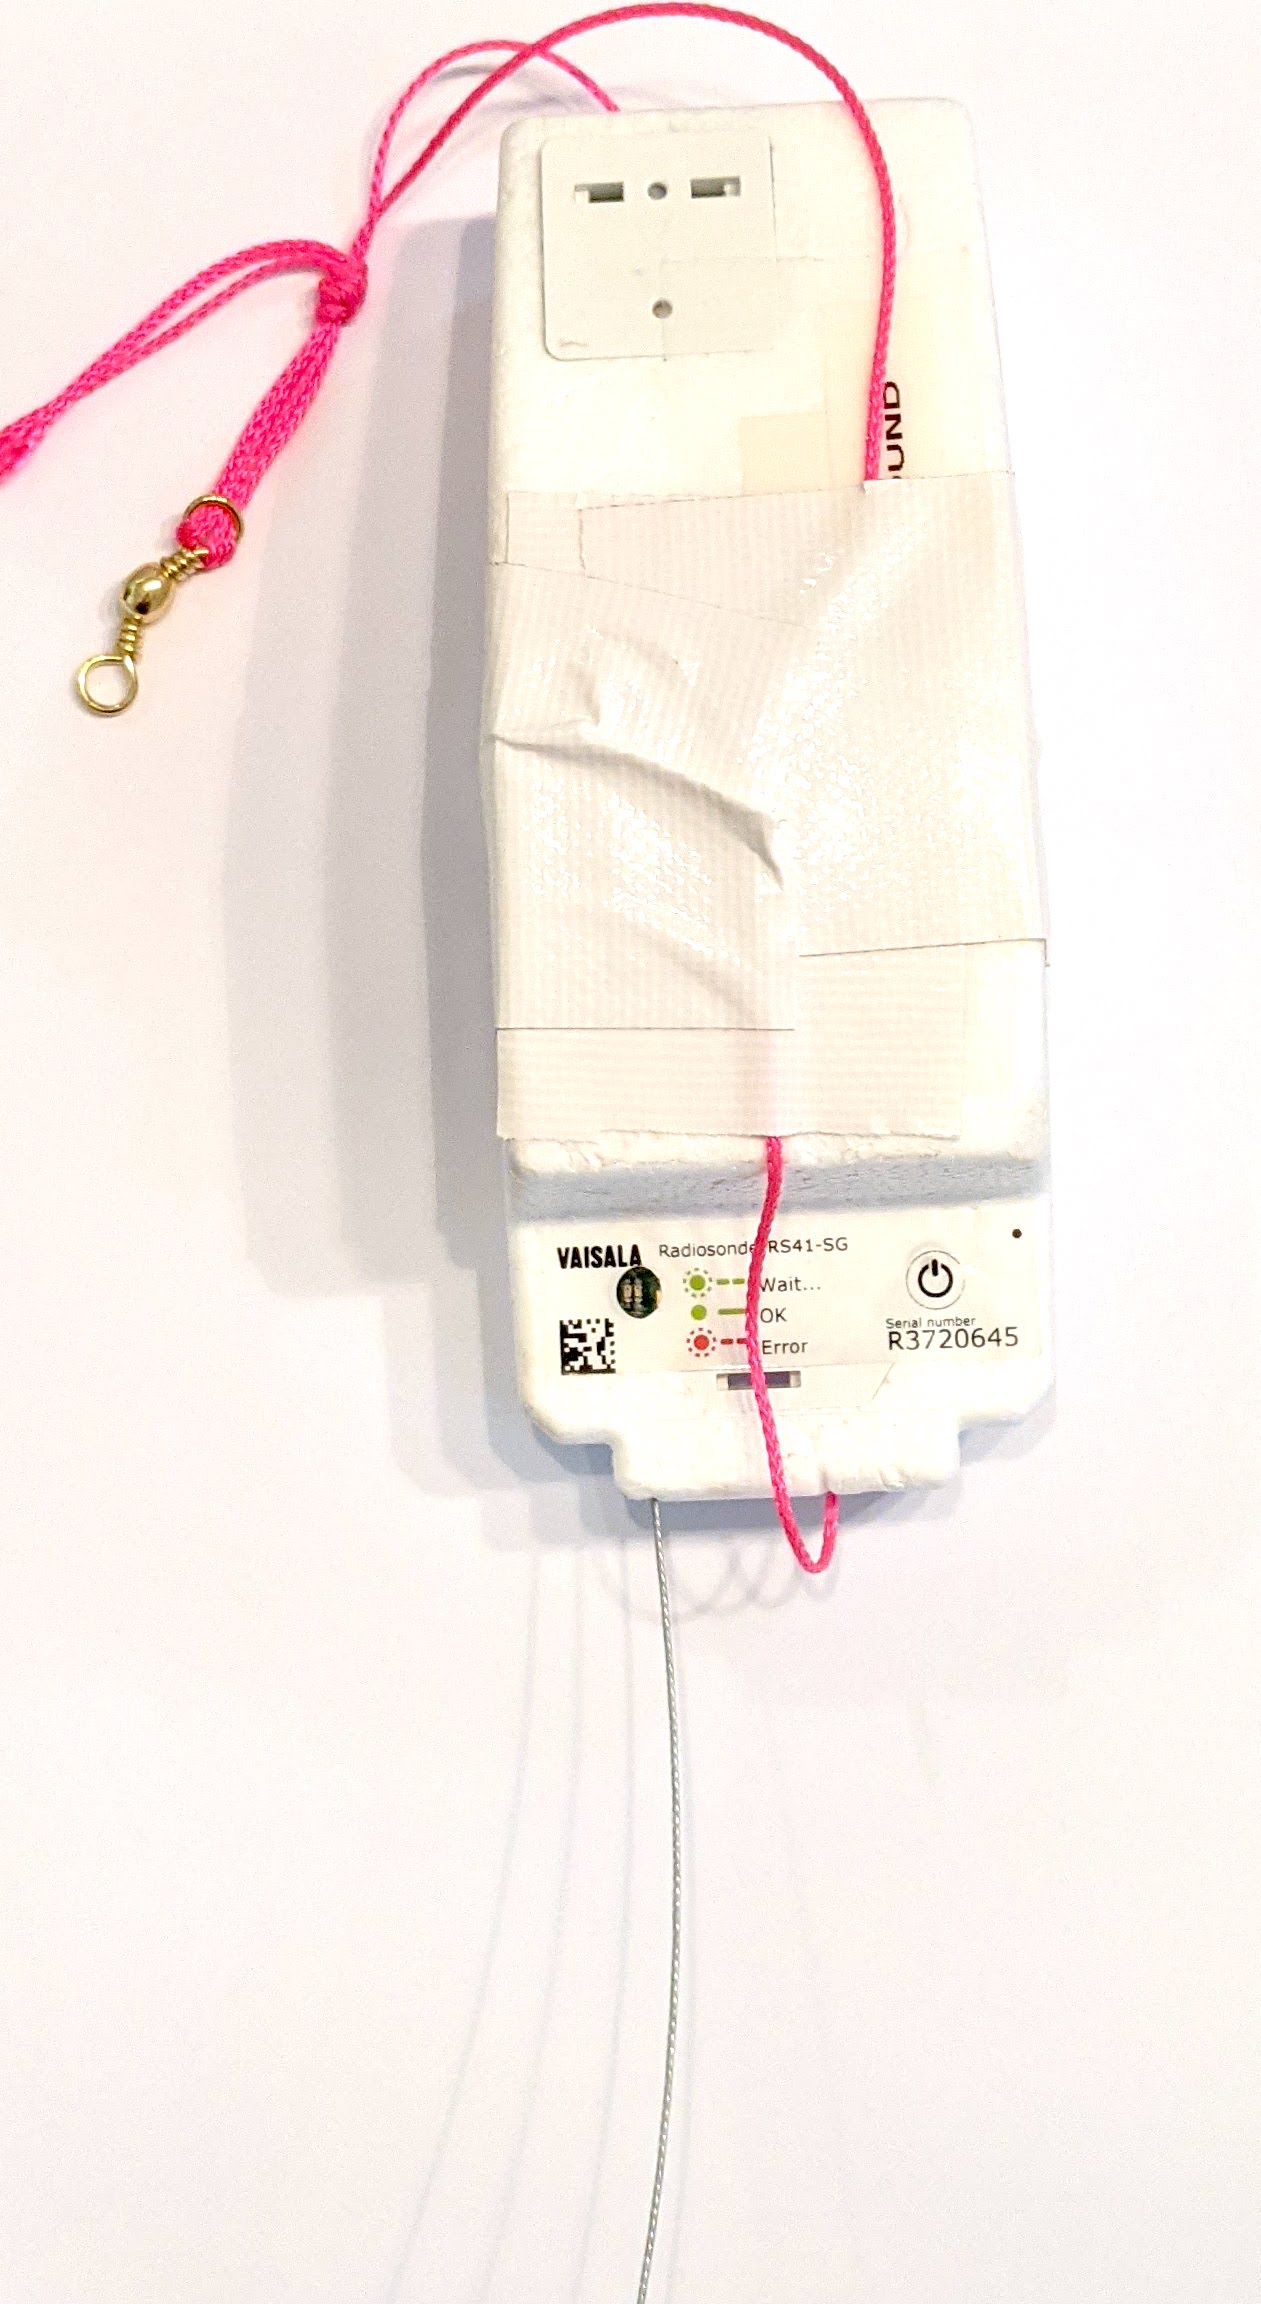
Primary Telemetry – Horus Binary 434.200 MHz – HORUS-V2
 The primary tracking telemetry will be transmitted on 434.200 MHz using the Horus Binary 4FSK data mode. Amateurs in the Adelaide and Central SA region are also encouraged to get involved with the flight through receiving and uploading flight telemetry from our 70cm band tracking beacons. Every piece of telemetry data is valuable to the flight tracking and recovery teams so if you can help join the distributed receiver network to collect that data you will be making an important contribution to the project!
If you try receiving the telemetry from this flight, you’ll need a SSB-capable 70cm receiver (or a SDR), and the Horus-GUI telemetry decoder software. A brief guide on setting this up is available here: https://github.com/projecthorus/horusdemodlib/wiki/1.1-Horus-GUI-Reception-Guide-(Windows-Linux-OSX)
Listeners that already have Horus-GUI installed are encouraged to update to the latest version, which is available at this link.
Note that you will need to use a USB ‘dial’ frequency of 434.199 MHz for the 4FSK signal to be centred in your receiver passband and hence be decodable.
Backup Telemetry – Horus Binary 434.210 MHz – VK5ARG
A backup tracking payload will be transmitting on 434.210 MHz using the Horus Binary 4FSK data mode, and can be received in the same way as the primary tracking payload, with information above. For this payload you will need to use a USB ‘dial’ frequency of 434.209 MHz.
Wenet Imagery – 443.500 MHz
Imagery on this flight will be transmitted via the Wenet downlink system, which uses 115kbit/s Frequency-Shift-Keying to send HD snapshots. Reception of the Wenet imagery requires a Linux computer, a RTLSDR, and a 70cm antenna with some gain (a 5-element Yagi is usually enough).
This payload will be experimenting with a PiCam v, which we previously flew with only partial success on Horus 59. This time around many software updates have been written, hopefully allowing the PiCam v3’s autofocus to work on a balloon launch. This flight aims to test out these software changes, and gather data to help improve performance on future launches.
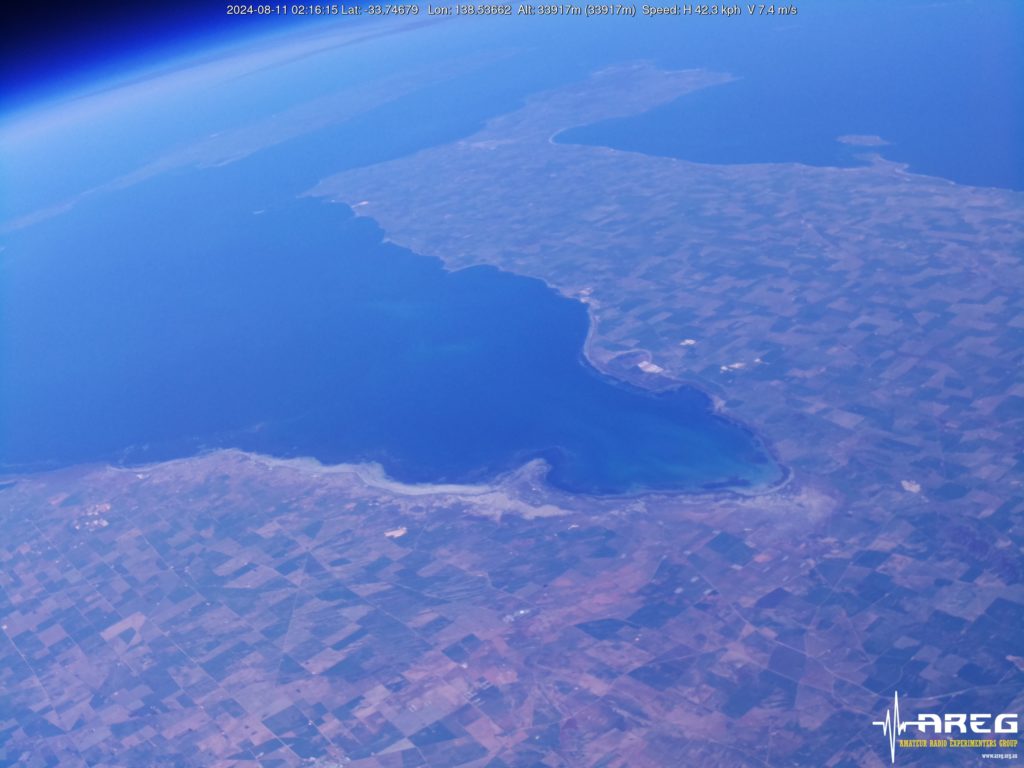
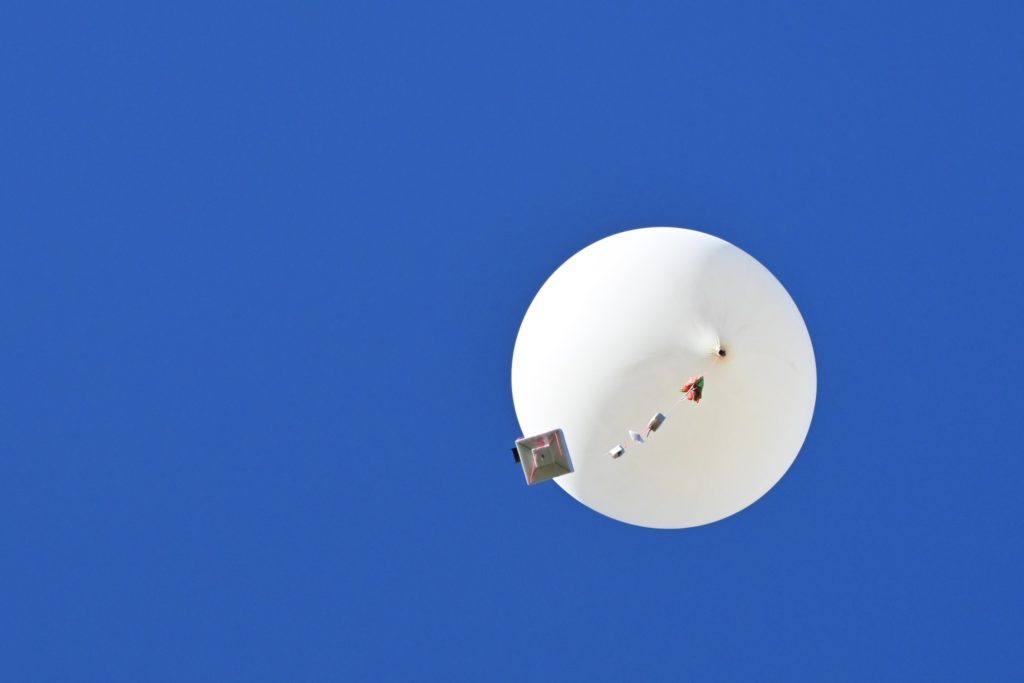
Wenet imagery from Horus 62
A guide on how to get set up to receive the Wenet signal is available here: https://github.com/projecthorus/wenet/wiki/Wenet-RX-Instructions-(Linux-using-Docker)
Please note the transmit frequency of 443.5 MHz, which may require listeners to re-configure their Wenet setup.
Note: Stations that are already ready to receive Wenet are advised to update to the latest testing version for this flight. See here for instructions: https://gist.github.com/darksidelemm/cdc36a90ca96b87d148fdd7d68d5d5fe
During the flight, the live imagery will be available at this link: http://ssdv.habhub.org/
TheThingsNetwork Payload – 915 MHz LIPD Band

This flight will also fly a LoRaWAN payload built by Liam VK5ALG, relaying positions via TheThingsNetwork (TTN), a global Internet-of-Things network with hundreds of receiver gateways across Australia. You can find out more about how TheThingsNetwork works here.
The aim of this payload is to test a new antenna, and try and beat our previous range records on the 915 MHz band.


