
An X-class Solar Flare imaged by the Solar Dynamics Observatory in 2012.
Solar flares from the sun can result in many different effects on High Frequency (HF) propagation. The most immediate and noticeable is when the increased solar X-Ray flux resulting from a flare interacts with the ionosphere. These X-Rays charge the ionosphere’s D-layer (responsible of the absorption of the lower HF band during the daytime), and results in higher levels of absorption extending right up to the top of the band. This has the effect of reducing signal strengths right across the band, resulting in what is known as a ‘HF fadeout’.
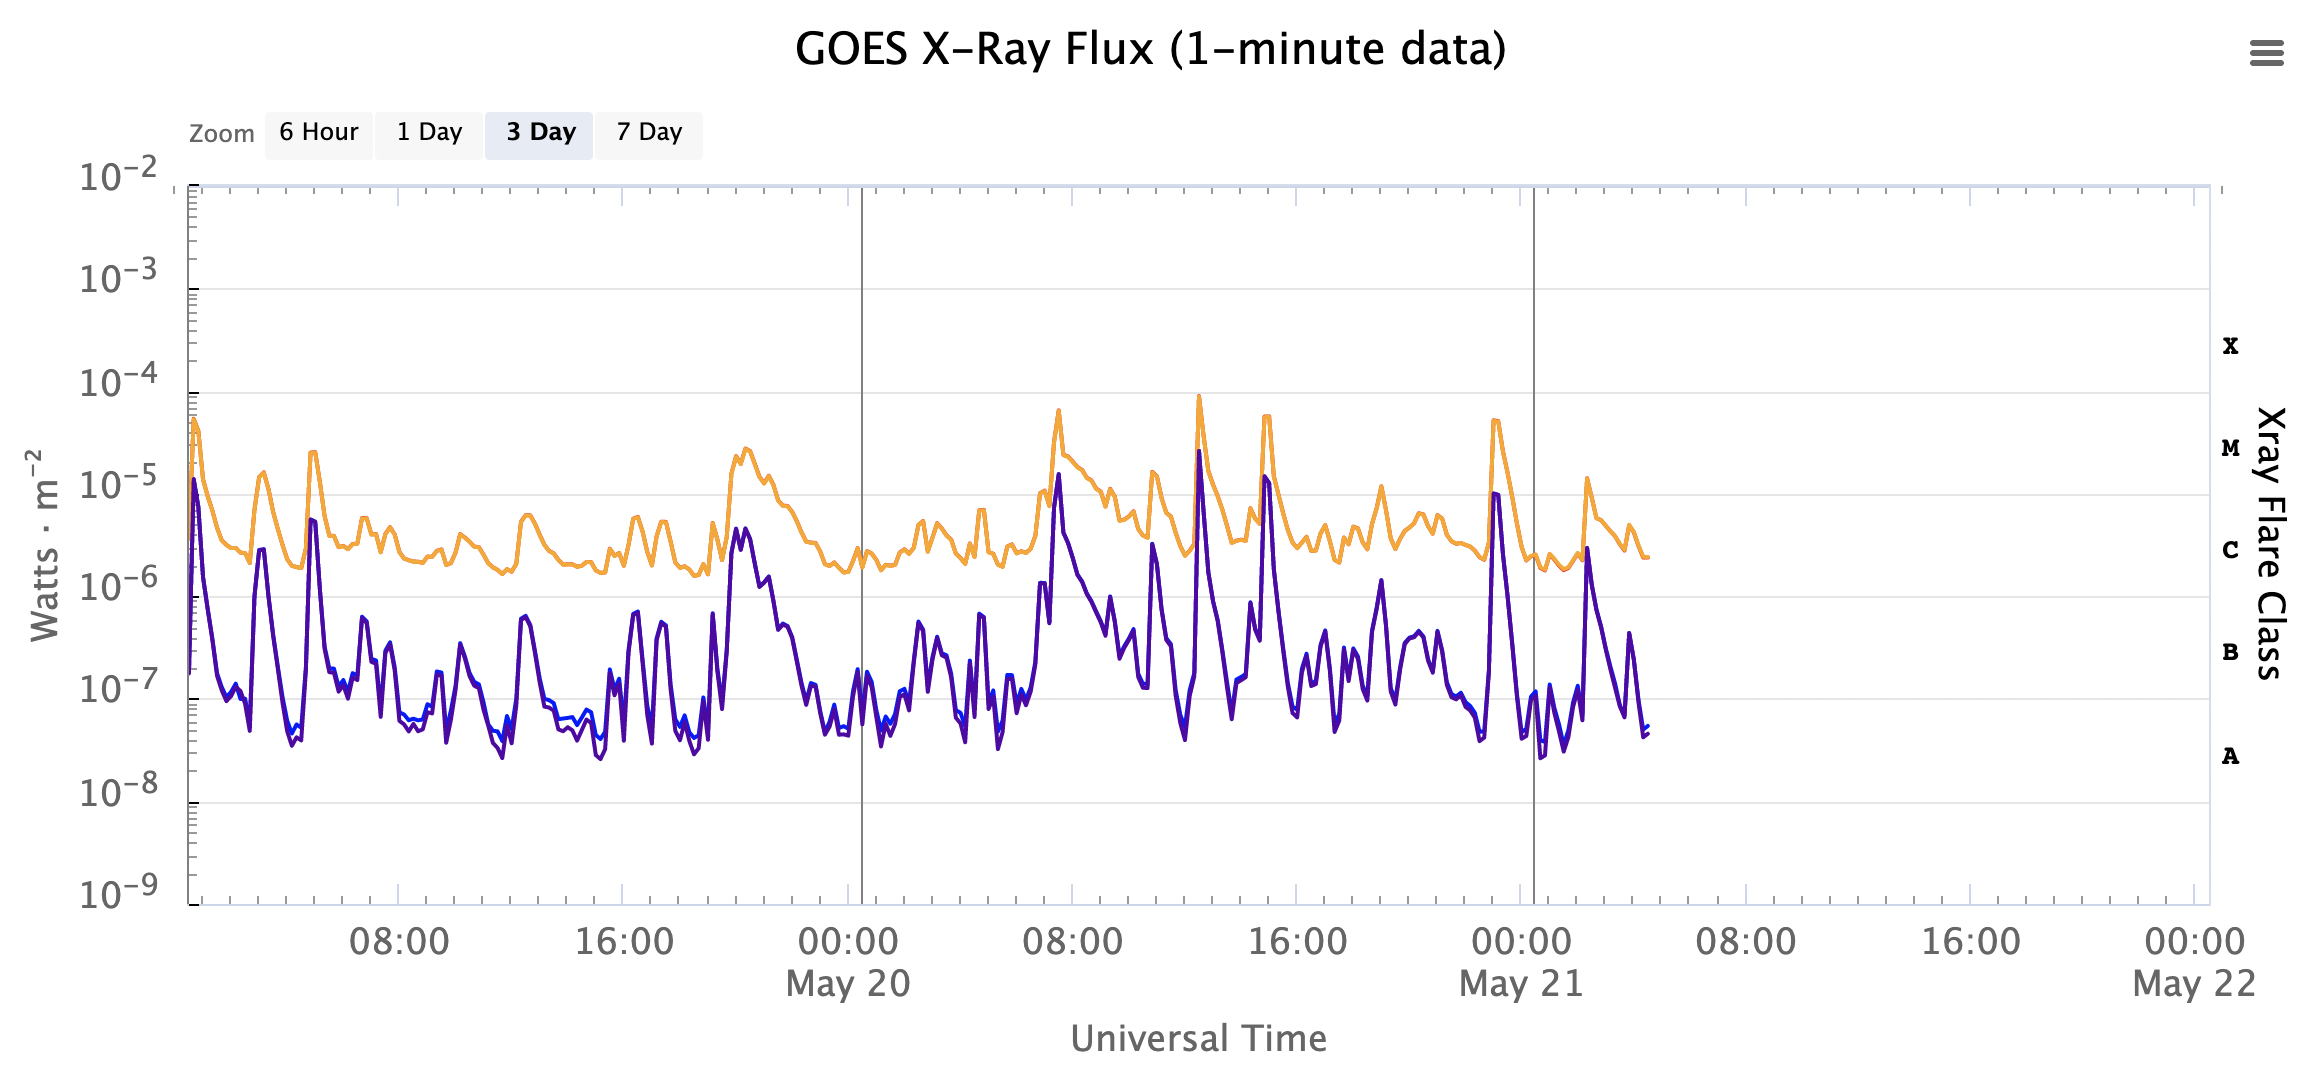
X-Ray Flux data from the GOES satellites, provided by NOAA
Solar flares are categorised based on the peak X-ray flux they emit, with the different levels given letters A, B and C for relatively weak flares, and M and X for stronger flares, with X-class flares being the strongest. HF fadeouts are generally caused by M and X-class flares. A live plot of X-Ray flux data as observed by the Geostationary Operational Environment Satellites (GOES) is available here: https://www.swpc.noaa.gov/products/goes-x-ray-flux
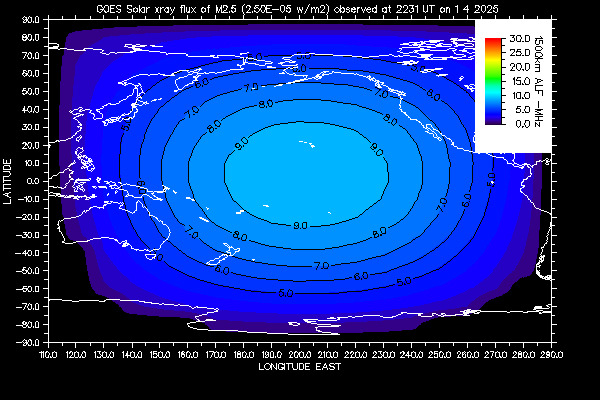
HF Fadeout Coverage area for a M1.2 class flare, from the Space Weather Service website.
The Australian Space Weather Service provides a HF fadeout warning service via email, and you can also see reports of the most recent HF fadeout on their website.
AREG’s HF Spectrograph Service
AREG hosts many services at its remote HF receive site located near Tarlee, including multiple KiwiSDRs, skimmers for WSPR, FT8 and SSTV, and other higher performing receivers reserved for club members. We thank Swoop Internet for providing us with the internet service at this site, for free!
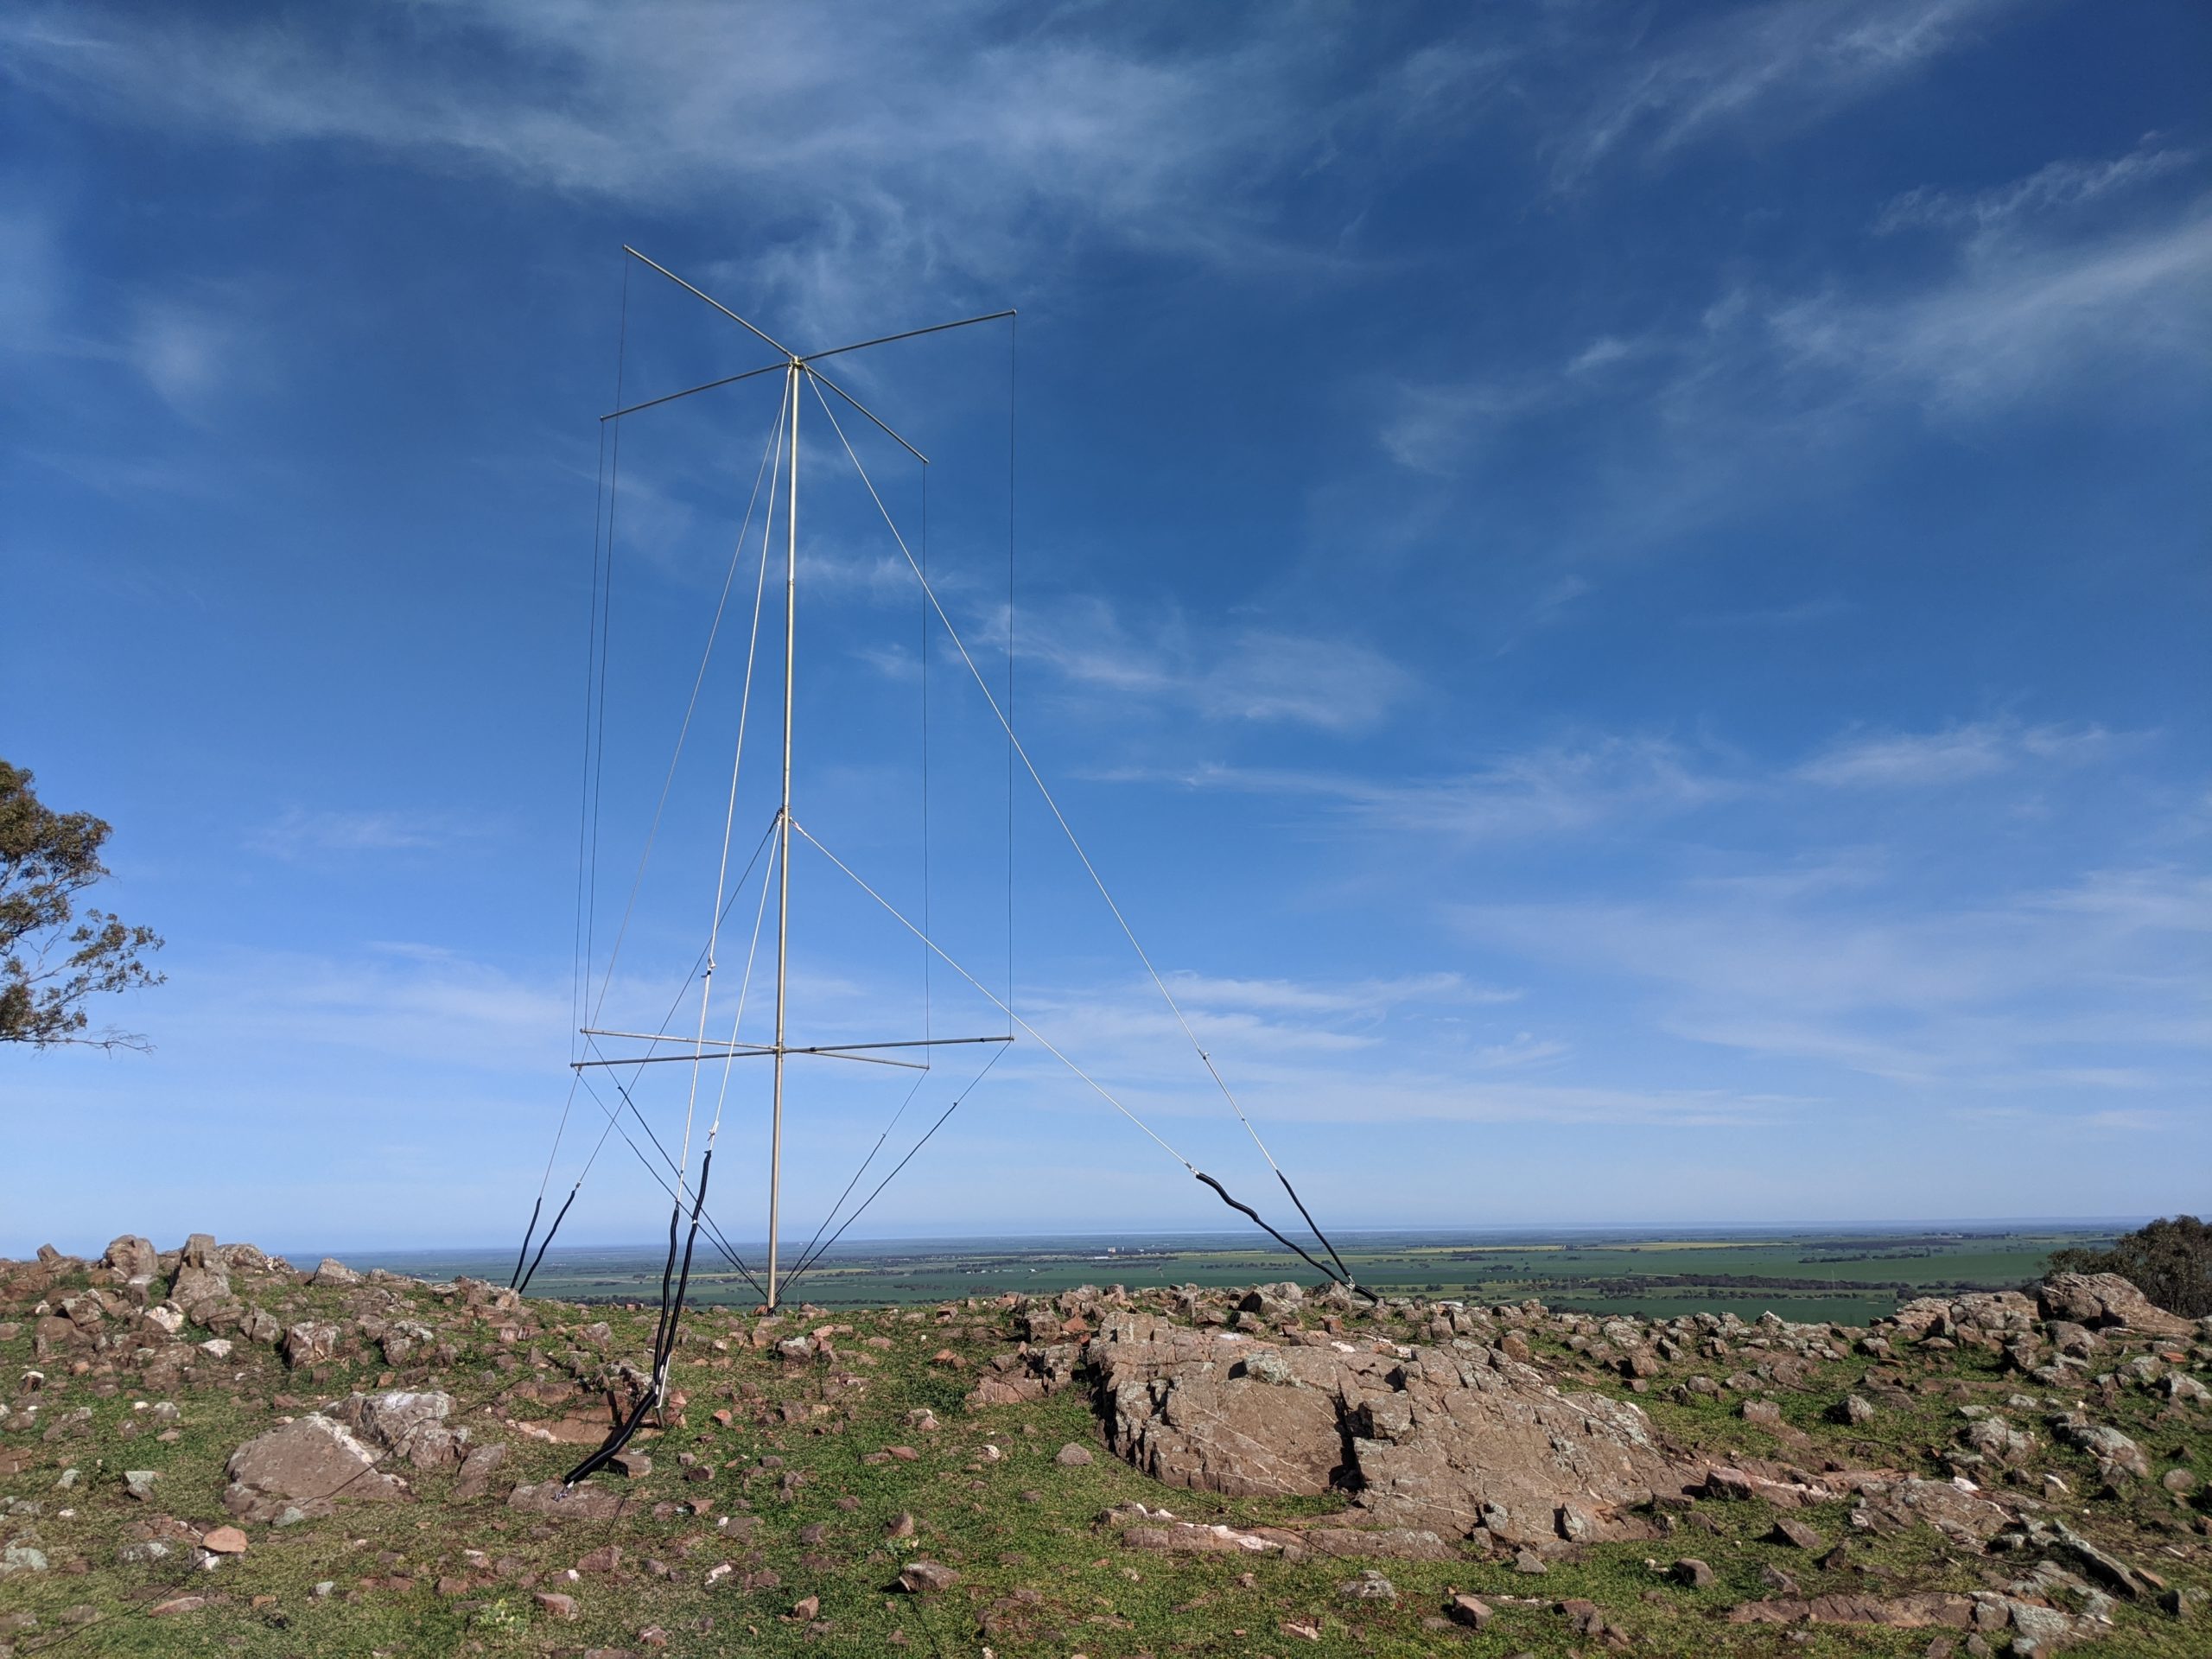
The HF receiver antenna (a broadband monopole) at AREG’s remote HF receive site.
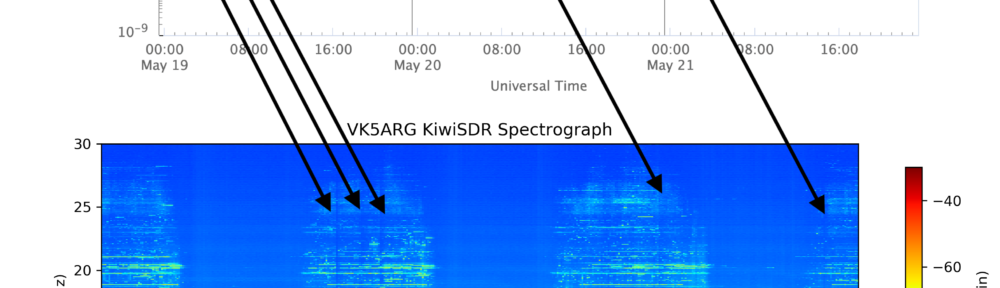
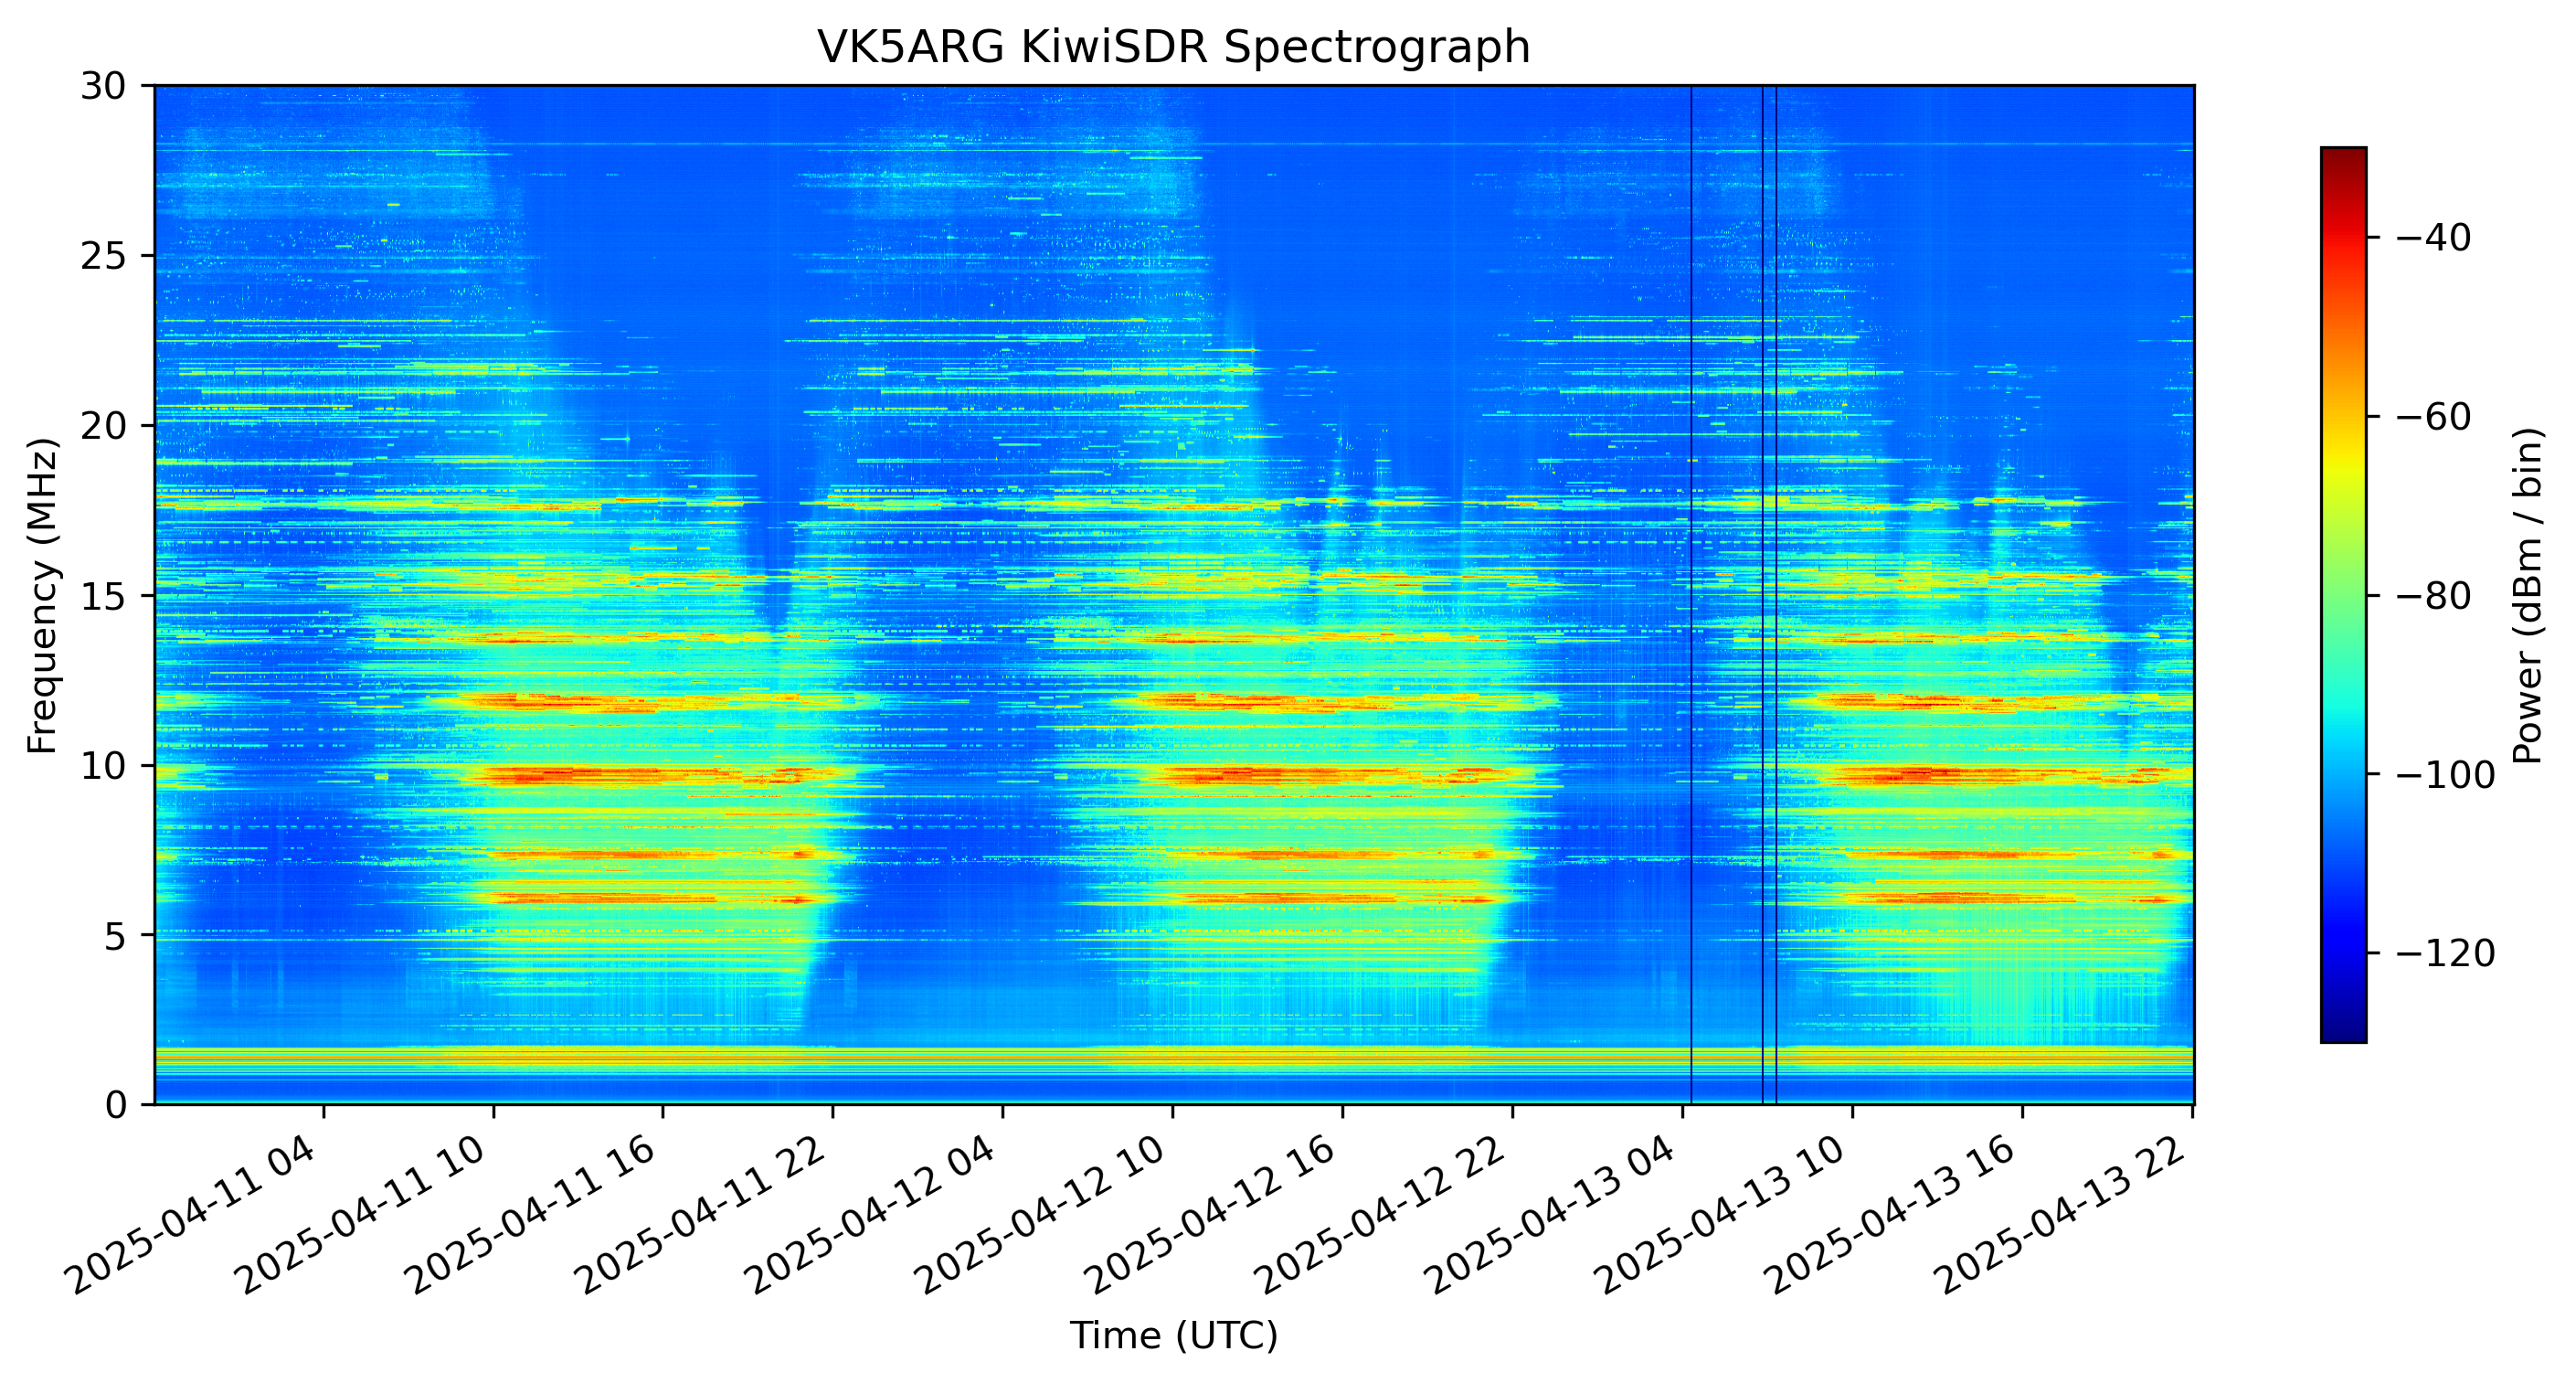
Using software written by Mark VK5QI, AREG also generates a Spectrograph showing the state of the HF band over the last 3 days. A spectrograph is similar to the waterfall display you might have seen on other SDR receiver software, though in this case covering the entire HF band (0 – 30 MHz), and looking over a much longer timescale. Warmer colours (reds and yellows) represent stronger signals, and cooler colours (blues and greens) represent weaker ones. The spectrograph updates approximately every 30 minutes, and is available at the bottom of the Remote HF Receiver site page, or directly here.
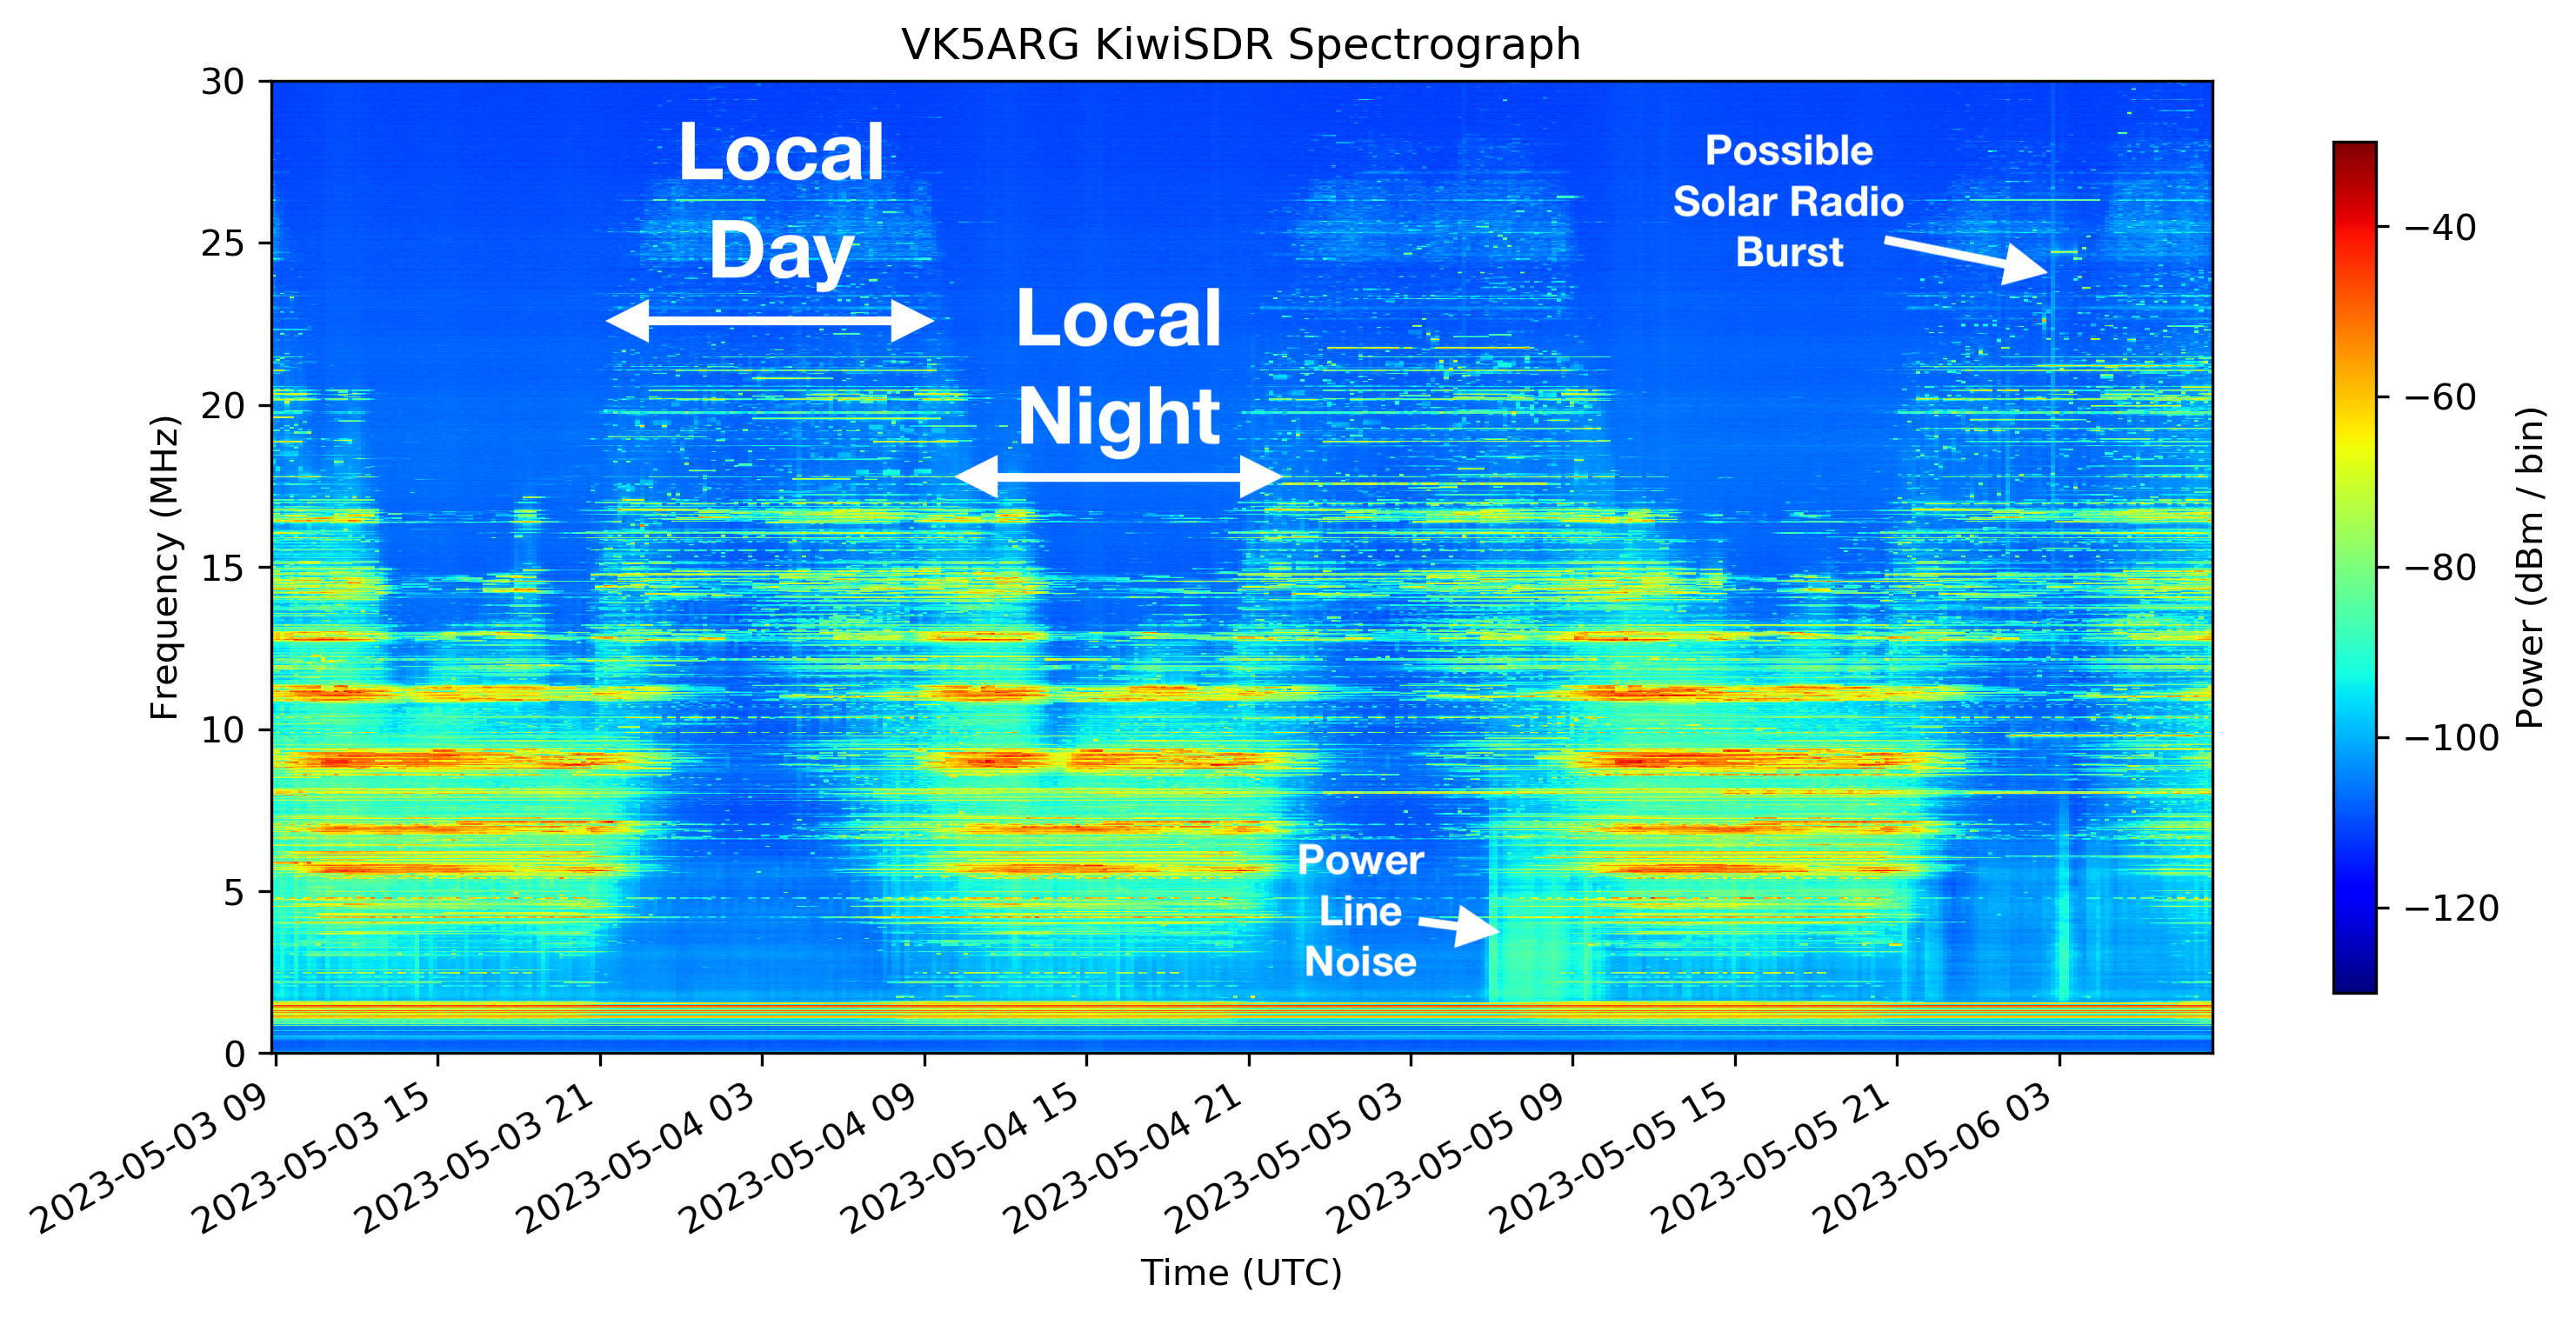
A typical HF Spectrograph, with some features annotated.
The spectrograph gives us a ‘quick look’ at the state of the HF band. The strongest signals (red) are the bands of shortwave stations around 6, 7, 9 and 11 MHz, mostly propagating in from south-east Asia. The most obvious time-varying effect is the change in propagation conditions from day (propagation mainly at the higher end of the band), to night (propagation mainly at the lower end of the band), but we can also see other effects such as solar radio bursts, local noise issues, and of course HF fadeouts.
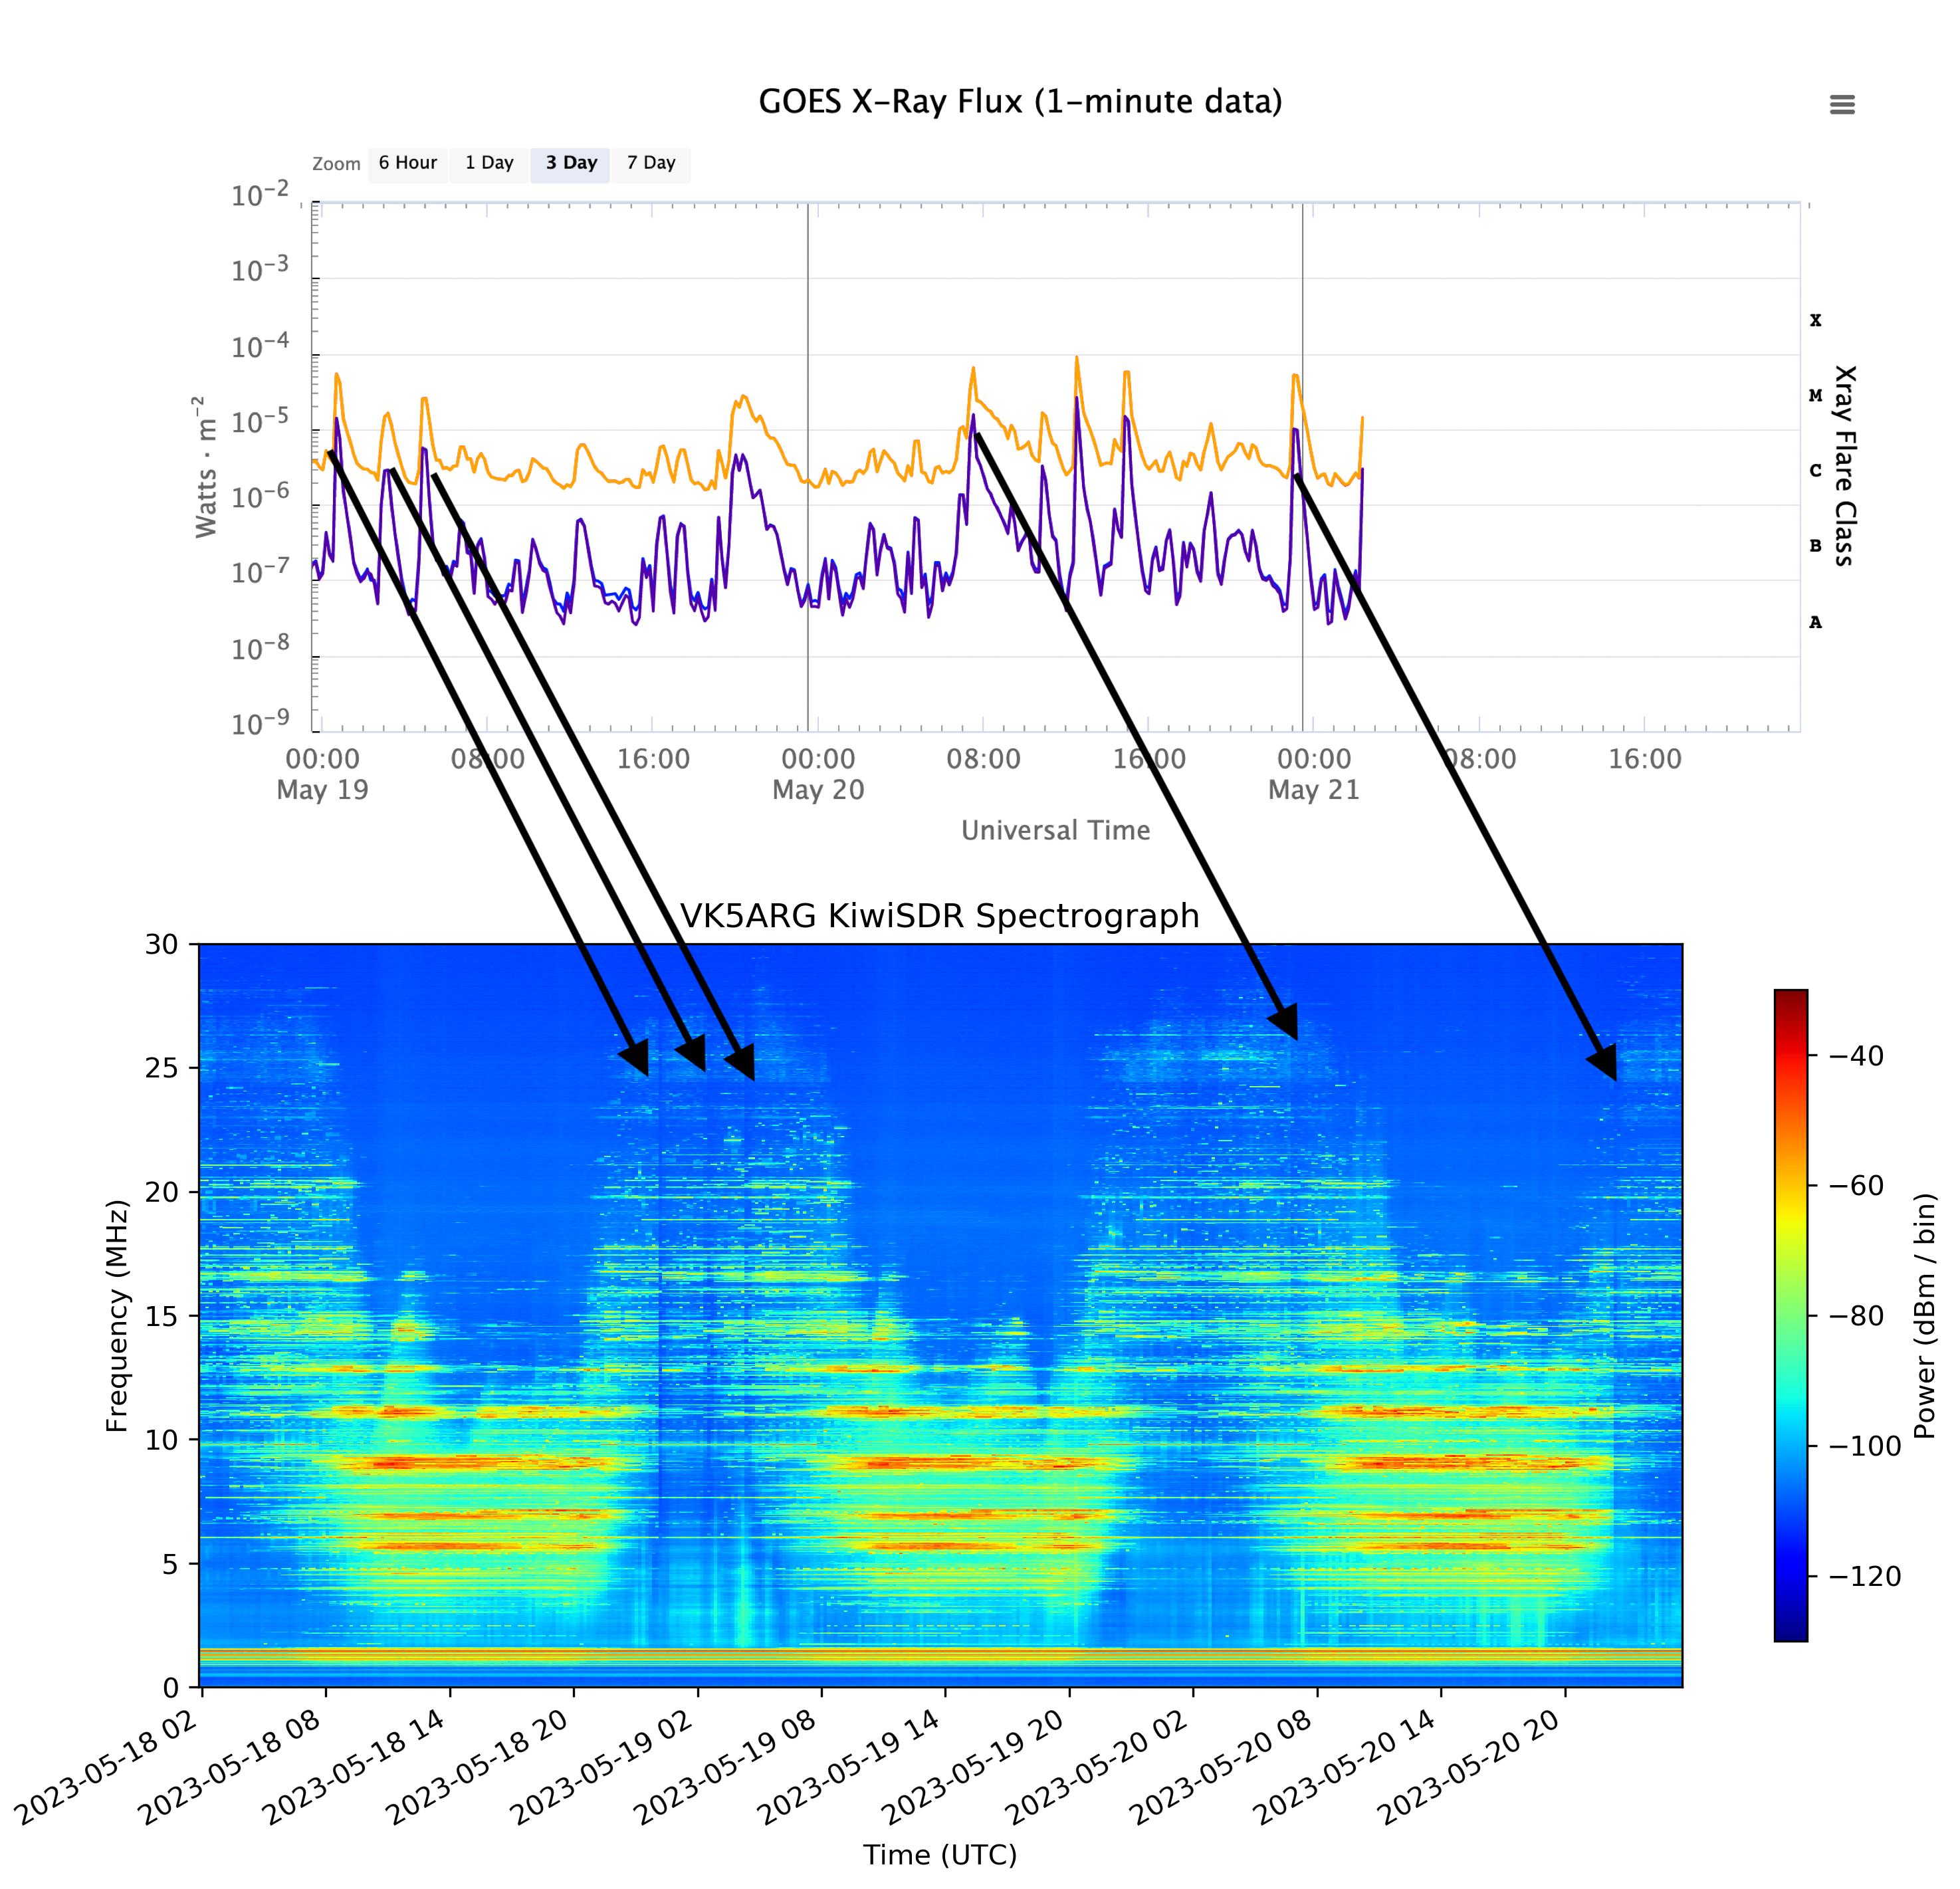 In the above figure, a number of HF fadeout events over the 18th through 20th May 2023 period have been marked, showing the X-Ray flux event they correspond to. The HF fadeouts can be seen as a sudden reduction in signal strength right across the HF band, followed by a slow return to normal. Note that we don’t see the effects of X-ray flux events occurring during our local night, due to the Earth sheltering us from those X-rays.
So, next time you think the HF band seems a bit dead, maybe go take a look at the AREG HF Spectrograph to see if there’s a HF fadeout in progress!
73 Mark VK5QI