Project Horus has had a long relationship  with the UK High Altitude Society who provide an excellent platform for tracking on monitoring balloon flights through their habhub.org website.
On this page you will find multiple resources for tracking our Project Horus balloons including the flight track monitoring pages.
Tracking System Basics
The fundamentals of the tracking system are best explained in the following diagram:
![]()
Both stations in the field chasing the balloon as well as home stations actively participate in these flights through the collection of telemetry data which is then used to predict where the balloon will land.
 A really good description of how to set up your station to track the balloon is available from the UKHAS website (Click on the logo →)
The following is a summary from that site (extracted 25th Jan 2016).
Beginners Guide to Tracking using dl-fldigi
This is a short guide to receiving live tracking data from a balloon sending out GPS fixes. Covering setting up a radio, computer and the software to upload the tracking data to a central server.
Background
How does this all work? We are using the receiver, soundcard, and computer to do Software Defined Radio.
This is using the computer to do a lot of the heavy lifting, rather than the traditional way which might be an integrated radio and modem, which is a lot less flexible (and more expensive!).
SSB (single sideband) radio was initially developed as a low power way to send voice. The exact way it is encoded and decoded are irrelevant.
We use it simply to capture a small part of the radio frequency spectrum, and shift it into a range the soundcard can accept.
How this works is that the transmitter broadcasts a ‘0’ at 434.450MHz (for example) – the SSB radio is tuned to 434.449MHz (1000Hz lower). The SSB receiver outputs a tone that is simply the input frequency minus the tuning frequency.
| Data sent | Transmitter frequency | Receiver Frequency | Difference/output |
|---|---|---|---|
| 0 | 434.450000 | 434.450000 | 1000 |
| 1 | 434.450200 | 434.450200 | 1200 |
1000Hz and 1200Hz are easily in the audible range (the receiver will only output from around 300-3000Hz) – and are passed to the soundcard.
The tones are then used by fldigi to decode the RTTY signal – which is basically just RS232 – old fashioned serial – at 50 bits a second. The two tones appear in the above ‘waterfall’ window of fldigi (see below) as two yellow bands (other signals are interference and noise) and are what the decoder lines should be centred over.
There is a 30-sec recording of live data mp3 version and wav version. These files are about 500kB.
Please practice decoding in OFFLINE mode to eliminate any confusion with old data from this clip keep appearing on the map! You can do this by unchecking “online” on the “DL Client” dropdown. Settings to decode this should be 425Hz shift, 50 Baud, 8 bit ASCII, no parity and 2 stop bits. Decoding the data should look like this.
Unless you are very close, you won’t hear anything unless you have line of sight. This means that the balloon usually needs to be above your horizon.
(The telemetry audio recording above was made by Daniel Richman during one of Robert Harrison’s Icarus launches on Saturday 26th September 2009. The full “un-cut” two minute versions are mp3 and wav. Please note that these are about 1MB and 2MB respectively)
Radio
-
Most balloon flights in the UK will use 434.075MHz as their main transmission frequency, however due to the cold temperatures the radio frequency often drifts so at some point you’ll need to retune the receiver. In Australia we also use 434.650MHz. Check with your particular flight announcement for the correct frequency to monitor.
-
Set up the radio, turn it on, select USB (Upper side band) and tune to 434.075MHz or 434.650MHz. Once the balloon has been launched you’ll need to listen for a bit to see if you can hear anything then tune up and down a bit (+/- 10kHz). If you are using a directional antenna (e.g. Yagi) you’ll need to point this in roughly the correct direction. Moving the antenna position may also help – some buildings block the radio frequency.
-
You might still be out of range so if you don’t hear anything check you’ve got the right settings and try again in 10 minutes. Pop on to #highaltitude to check that the launch has taken place and that others are getting the signal.
-
Once you start hearing the signal it’s time to get decoding.
Computer
dl-fldigi
dl-fldigi is an adapted version of the excellent free FLdigi soundcard decoding software. It takes the audio from your radio, decodes the balloon’s signal, and then sends the telemetry it’s found over the internet to a server running habitat, which plots the payloads position on to the SpaceNear.us map.
-
Download the software from the relevant link that matches your system
-
Version 3.1
-
Source:
-
dl-fldigi on Github. The git commit of the latest stable release is 2abd6a7 (tag DL3.1).
-
-
Binaries:
-
Mac OS X (10.5.8 ONLY): dl-fldigi-DL3.1-macosx-10.5.8-2abd6a7.dmg
-
Windows: dl-fldigi-DL3.1-windows-2abd6a7.exe
-
Ubuntu Linux debs: https://launchpad.net/~simrunbasuita/+archive/dl-fldigi
-
-
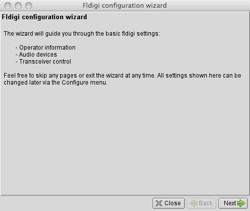
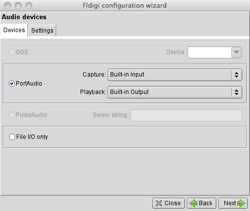
Open up dl-fldigi in HAB mode (now the default mode for OSX). On first running it’ll open up a wizard to help setup dl-fldigi for you.
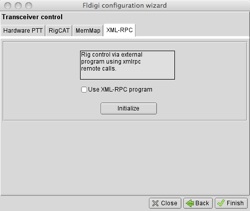
-
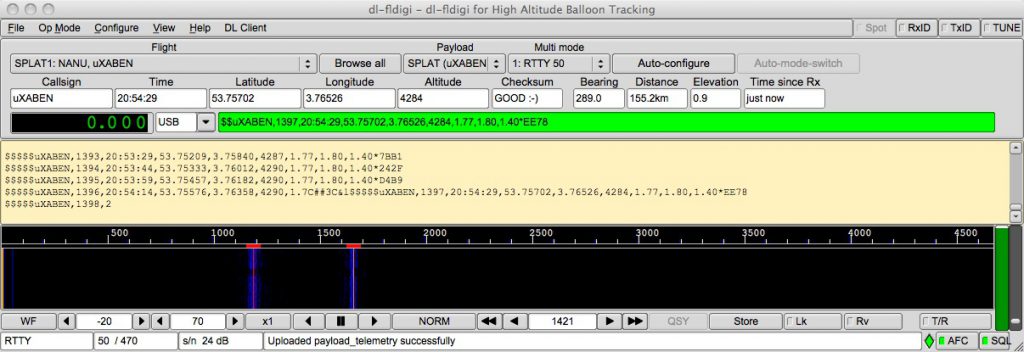
This new version parses the data it receives and splits it up into the boxes and calculates the distance and bearing that the payload is from your base station (based on the latitude and longitude you previously input). You may need to resize the window width when you first open dl-fldigi to fit your screen.
-
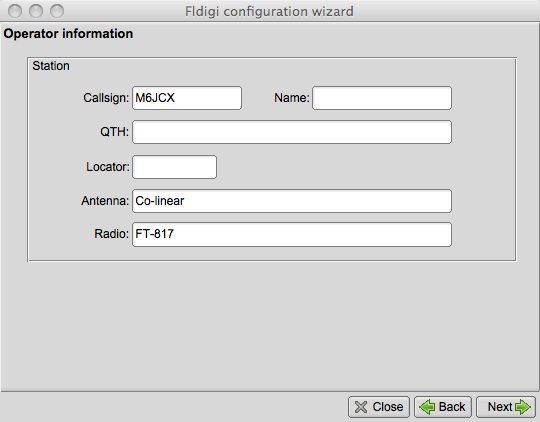
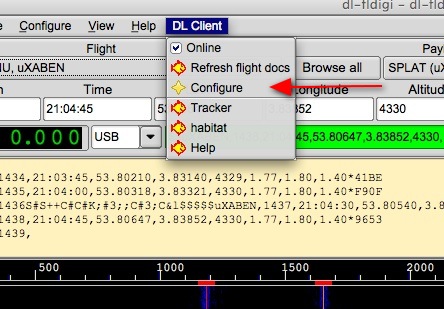
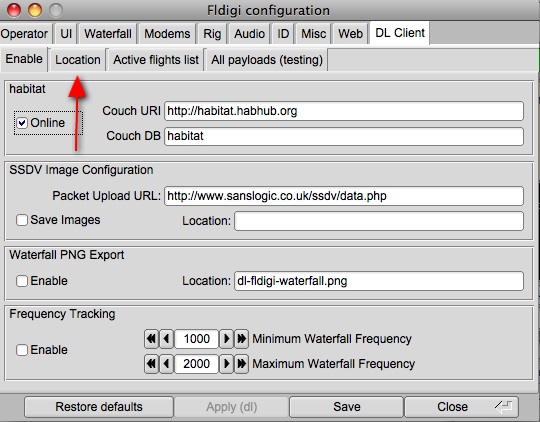
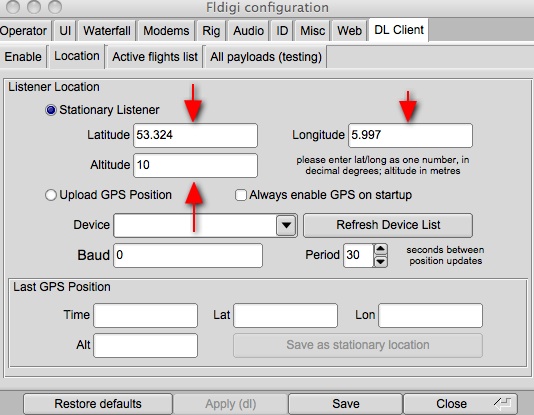
First thing is to enter your location (this is required to appear on the map and to calculate distance, elevation and bearing (Please remember to put in your latitude and longitude in decimal format using + or – rather than NSEW e.g. 52.0000 -0.12345 You will also need to put in your altitude, you can put in 0 if you don’t know this)
-
dl-fldigi if connected to the internet should automatically download a list of the possible payloads. To view them select the ‘Flight’ dropdown box.
-
Once you’ve selected your payload you need to click on the Autoconfigure button which will setup dl-fldigi for tracking.
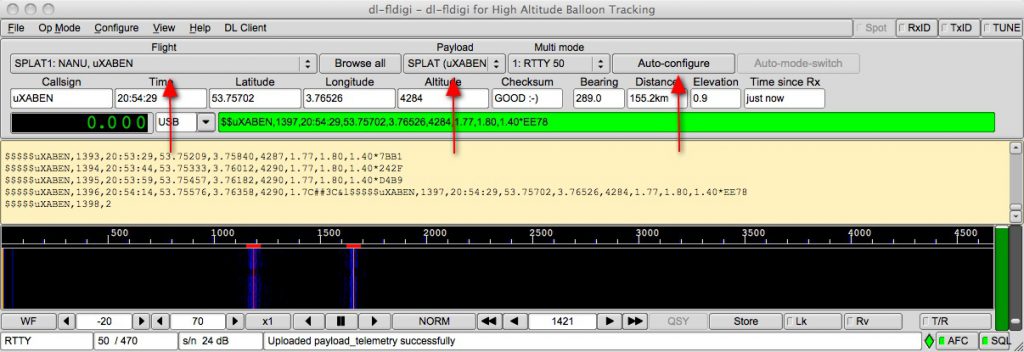
- Green means that the string passed its checksum test while red means it failed. Feedback from the server can be seen in the bottom status box.
Internet
-
dl-fldigi forwards the strings to the central server.
-
Statistics and data can be found here http://habitat.habhub.org/
-
The server does further checks and then will post the points to the habhub tracker
-
You can also track using Google Earth by using the following link http://tracker.habhub.org/track.kml, for more details on how to get the best out of Google Earth see using_google_earth
-
If you wish to try out receiving and decoding data without posting to the central server, then please refer to version specific instructions on the dl-fldigi project page.